We’re going to look at the BBC Trust’s politically driven decision to censure, silence, Quentin Letts and his programme about the Met. Office. In light of that here’s a warm up with some questions about the Met. Office’s conclusions drawn from the ‘science’……
This is the key paragraph in a Met. Office report on climate change….
In UKCIP02 we showed results from experiments (Stott et al., 2000) which indicated clearly that recent temperature rises could not be explained by natural causes. In that paper, the Met Office Hadley Centre climate model was driven over the period 1860-2000 firstly with only changes in natural agents (solar output, volcanic aerosol); the modelled temperature rise was in poor agreement with that actually observed, especially over the last few decades. Only when changes in forcing from human activities (greenhouse gases and sulphate aerosols) were added could the temperature rise over the last few decades be replicated by the climate model.
It explains that any global warming after 1970 or so is due in the main to man-made causes and not fom the likes of soalr output or volvanic activity. It is the essential ingredient in the IPCC’s case for global warming and the attribution of that to man-made causes.
Not sure how they come to that conclusion as the rate of warming post 1970 is the same as in previous periods……something even the CRU’s top boffin and climate alarmist, Phil Jones, admits to Harrabin….not the answer Harrabin was looking for methinks…
RH – Do you agree that according to the global temperature record used by the IPCC, the rates of global warming from 1860-1880, 1910-1940 and 1975-1998 were identical?
PJ – In answer to the question, the warming rates for all 4 periods are similar and not statistically significantly different from each other.
So if the rates were similar how is it that the most recent period is attributed to man-made causes? The Met. Office says solar output and volcanic activity have decreased…..if they were the same plus man-made warming the warming would be even higher than it is…however it’s the same as those other two periods.
You can see and compare the periods here……

Here’s CO2…..note not the same path…CO2 rising in 1880 but temperatures dropped for decades….

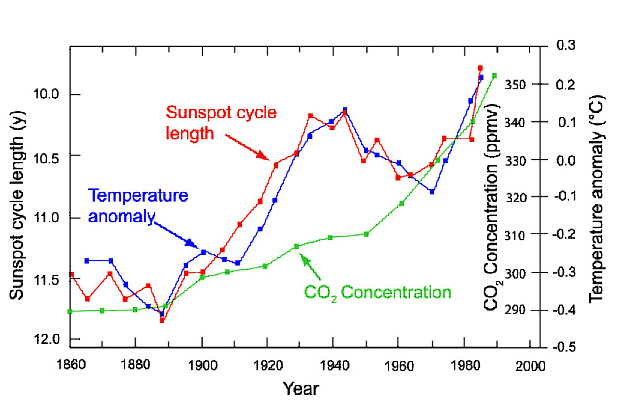
As for solar and volcanic activity dropping…hmmm…doesn’t look like it and the infamous sunspots seem to have a good correlation with temperature…….at least as much as CO2’s correlation…..

This graph of solar irradiance seems to follow temperature patterns as well…..


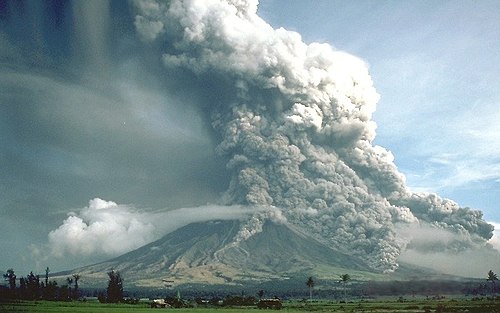
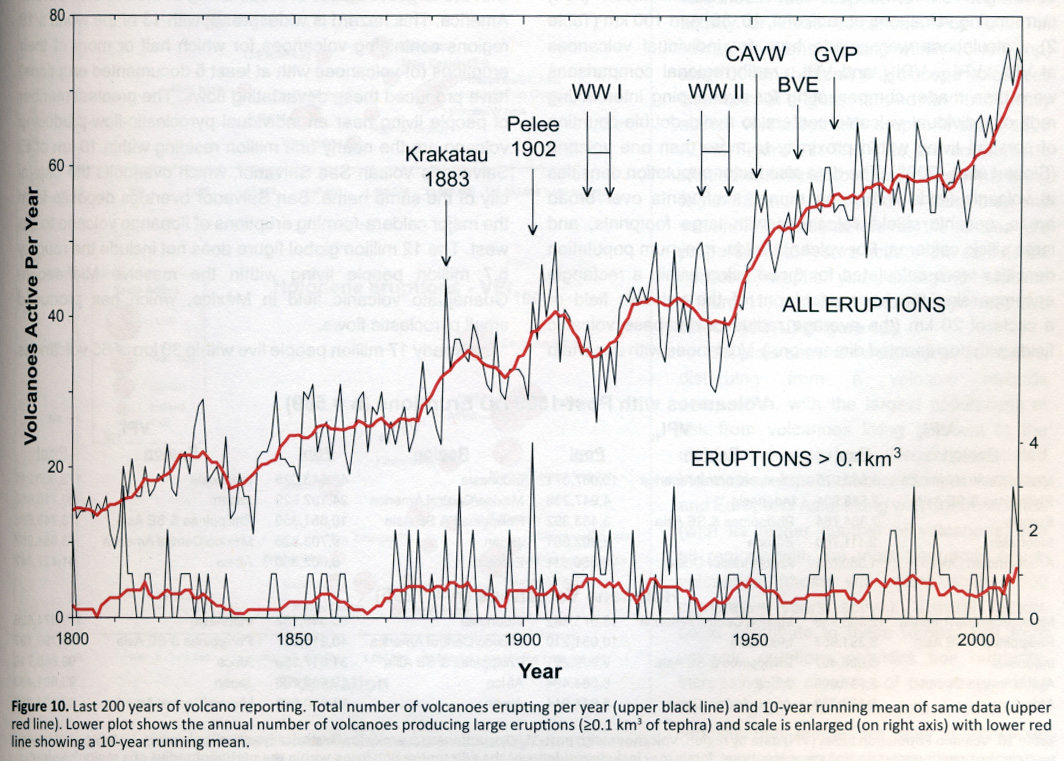
I’m pretty sure this graph shows volcanic activity has risen and again has quite a correlation with temperature….


So is the Met. Office wrong to claim that there is little to no natural agency in recent warming? Looks like it is as the rate is the same as those previous periods…..you may conclude actually thinking about it that CO2 stops warming….if solar and volcanic activity have increased it should be warming at a higher rate than those other two periods…it’s not. Why not? What else has gone up? CO2. Must be a connection with cooling! Just joking. LOL.


Did you know that global warming is caused by increases in US postal charges? It must be true because if you plot the cost of a stamp in America and overlay global temperatures there’s an alarming correlation.


Similarly, the decline of the number of pirates in the world also corresponds to temperature rises.
I suggest we have a huge conference every few years in Paris with 40,000 delegates to discuss this. Tax payers should be made to pay for it and we should spend billions of dollars funding research to prove it and billions more funding activist groups to campaign and publicise it. If anyone argues with me, they should be branded “deniers” and persecuted.
Love it!
Interesting to see that the volcanoes active per year has been increasing in line with global warming. Could something be happening in the Earth’s core?
There must be a correlation between the amount of hot air produced by the BBC in their ‘objective’ and ‘balanced’ debates and the so-called rise in global temperature.
hot air
n. boasting; lying; nonsense. That’s just a lot of hot air. Ignore it.
See also: air, hot
The inconvenient 30-year post-war cooling – the one which led ‘scientists’ to scare us all shitless that another ice age would be upon us if we didn’t give up our fossil fuel addiction
http://www.populartechnology.net/2013/02/the-1970s-global-cooling-alarmism.html
– now seems to have been eradicated by constant upward adjustments to the temperature record, giving a nice smooth upward curve in line with the CO2 theory.
So if the data don’t fit the theory, change the data.
Yet another fiddle that has passed the BBC by.
Sorry to ask the same question again but reference the Global Temperature and Carbon Dioxide graph who decided to make the left and right hand scale intervals the number and size they are.
With a different scale each side the line would presumably diverge considerably either side of the 1980 “zero point” and not represent CO2 and temperature rising as if correlated. One might suspect the scales were specifically chosen to show “correlation”.