

This post shows the difficulty in using statistics to ‘prove’ anything…especially if the two sides are not singing off the same ‘hymn sheet’…i.e. not using the same sources of information or the same definitions…..especially so when one side knowingly uses statistics that don’t agree because they come from a different source or are based on a different definition in order to confuse the issue.
Victoria Derbyshire interviewed Nigel Farage on Friday and using statistics provided by BBC bean counters, tax experts in the BBC business unit, she lays into his figures on Europe and Quangos amongst other things.
This is what the Guardian says about Victoria:
Victoria works hard and doesn’t want her efforts ruined by a slack quote.
She is sensitive about her public persona, aware – possibly because she interviews so many politicians – that reputation is everything. So what is hers?
You know, I’m not super-intellectual, I work really hard at my job, but I enjoy it and it seems to come naturally.”
In an unguarded moment, she tells me she’d love to present Question Time in the future.
This interview can’t have done her reputation much good…she very stridently claimed that quango costs were only £30 bn whilst Farage said they were £60 bn…it is clear immediately that how you define a ‘quango’ is the baseline that needs to be the same for comparative purposes.
Derbyshire obviously was using a very narrow definition….whilst at the same time knowing exactly where Farage got his figures…and yet she compared as if the two figures were comparable and yet knowing they weren’t based on the same starting point.
It seems she was merely intent on deliberately trying to make Farage look like a liar, a fool or incompetent by using figures she knew to be ‘wrong’.
The Tax Payers Alliance was straight onto to her……
Robert Oxley @roxley 2h ‘@vicderbyshire heard quango cost discussion this morning. Here is our paper quoted by @Nigel_Farage http://www.taxpayersalliance.com/sapb.pdf
Victoria Derbyshire @vicderbyshire 1h @roxley thanks, will hve a look at weekend – is this the most upto date doc you have
Robert Oxley @roxley 1h @vicderbyshire Yes, Nigel was quoting earlier report. Main reason for difference is cabinet office have more narrow definition of quango
Robert Oxley @roxley 1h @vicderbyshire but if it quacks like a duck, and looks like a duck we call it one… e.g carbon trust
As soon as the interview was over I googled ‘quangos costs’ and immediately came up with Farage’s figures in a Telegraph report that was based on the Tax Payer’s Alliance’s own report….the figure the Telegraph came up with for 2010 was £60 bn.
The fact that it took 30 seconds or so to hit on Farage’s figures and the explanation from the TPA as to how they defined a quango tells us that Derbyshire could easily have found that also…or rather her ‘tax experts from the BBC business unit’ could have.
Derbyshire says she was using government Cabinet figures but this report from the House of Commons Library, which tells us that ‘This information is provided to Members of Parliament in support of their parliamentary duties’, gives a different picture showing the ‘Executive NDPBs (one type of quango) alone cost £46.5 bn:
‘Quango’ is an abbreviation of the phrase ‘quasi-autonomous non-governmental organisation’ and is often used as an alternative to the abbreviation NDPB which stands for ‘non-departmental public body’.
As at 31 March 2009, there were 766 NDPBs sponsored by the UK Government. Of these: • 192 were Executive NDPBs;
In 2008/09, total expenditure by Executive NDPBs was around £46.5bn.
405 were Advisory NDPBs; 19 were Tribunal NDPBs and 150 were Independent Monitoring Boards of Prisons, Immigration Removal Centres and Immigration Holding Rooms.
The report goes onto to quote the TPA report which states that in 2007-08 spending was over £90 bn in total if you include many bodies not officially called Quangos but which are to all intents and purposes:
The Taxpayers Alliance has published a list of public bodies which is much wider than that published by the Government as it includes bodies sponsored by the devolved administrations as well as local and NHS public bodies. According to its figures, in 2007-08 there were 1,148 Semi-autonomous Public Bodies operating in the UK, with Government spending over £90 billion on or through these bodies that year.33
The UK’s contribution to the EU Figures
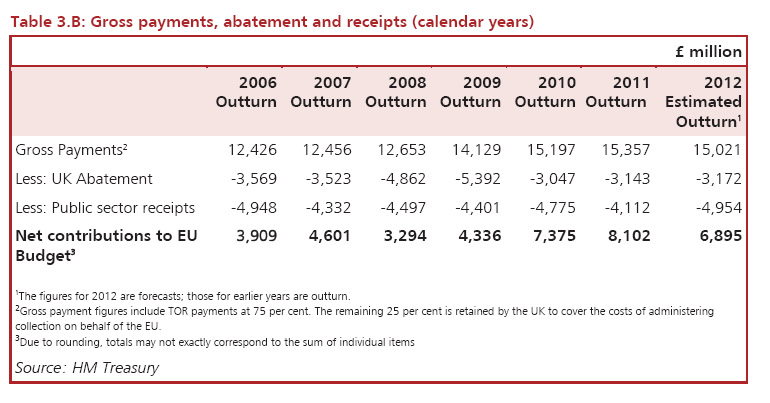
Derbyshire then launches into Farage’s figures on the cost of EU membership saying we only pay a net sum of £7 bn and that Farage says it was £20 bn…unfortunately again she is playing fast and loose with the figures…despite saying that getting the numbers right was ‘absolutely crucial’…..Farage’s £20 bn was the gross payment and that figure came from 2011…not 2012 as Derbyshire compared to….Derbyshire’s £7 bn was the net payment…from 2012.…but Farage was quoting, again, 2011’s figure of £8.2 bn.
Farage claimed the gross sum was around £20 bn and the net around £10 bn.
Derbyshire shrieked away at him.
But again it is a complicated subject and again depends on where you start from.
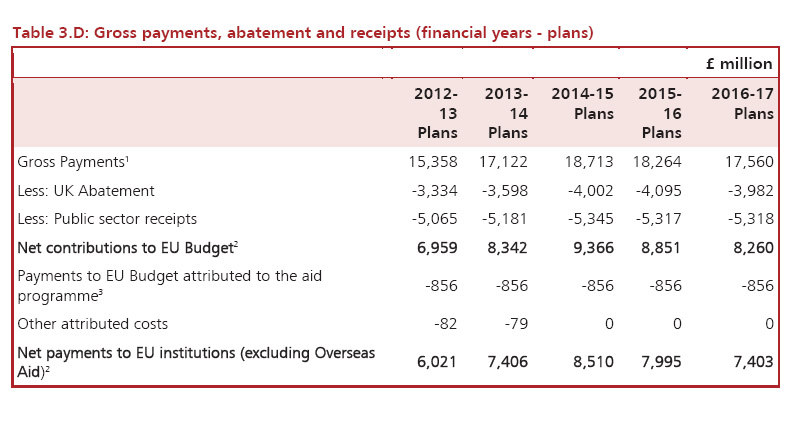
Here are the Treasury’s figures for EU contributions:
Here, using the Office for National Statistics sources, are the EU costs:
Annual Costs of EU Membership
The net cost of the EU budget to Britain in 2011 was £10.8 billion* and rising. But the actual cost – direct and indirect – is much more than that.
Last time it was calculated, in 2008, the European Union was costing us £65 billion gross every year. That’s about £1,000 each every year for every man, woman and child in the UK. It increases every year, so it will be a lot more now.
* Source: Office for National Statistics “Pink Book”
Here are the hidden costs:
Direct and Indirect Costs of the EU
Estimates of the true cost of the EU are difficult to come by. MPs have called many times for a cost-benefit analysis, to prove or disprove the benefits of membership. Successive Governments, both Labour and Conservative, have refused, on the grounds that the “benefits” are self-evident. In truth they are afraid of what such a study would show. The Bruges Group finally produced an authoritative study in 2008.
(http://www.brugesgroup.com/CostOfTheEU2008.pdf)
The total gross cost to the UK of EU membership in 2008 they estimate at around £65,000,000,000* – including:
£28 billion for business to comply with EU regulations,
£17 billion of additional food costs resulting from the Common Agricultural Policy
£3.3 billion – the value of the catch lost when the Common Fisheries Policy let other countries fish in our territorial waters
£14.6 billion gross paid into the EU budget and other EU funds. (In 2011 this had risen to £19 billion)
Roger Helme UKIP MEP quotes these figures:
The Office of National Statistics published the annual Pink Book on July 31st, showing inter alia the UK’s contributions to EU institutions in 2011. Gross contributions are now over £19 billion, while net contributions broke the £10 billion barrier for the first time — for a total of £10.78 billion.
And he tells us why using the gross figure is possibly more relevant:
‘….as Dan Hannan has pointed out, we should really focus on the gross figure. After all, if we look at the tax we pay, we don’t make deductions for the benefits we receive from the government in terms of health, education, welfare and so on. No. We just look at what we pay. And although some of our EU contributions come back from Brussels, it may well be spent on things we don’t value and wouldn’t have done ourselves. As I have said many times, they give us back a little of our own money, they tell us what to do with it, and then they expect us to be grateful.’
So you can see that it is possible to come up with quite different EU costs and contributions depending what you include in the data.
It is therefore somewhat unfair for Derbshire to ambush Farage using statistics that he wasn’t using…and not mentioning that EU costs vary enormously from year to year…and that they look to be going up quite considerably in the near future…and with the graphic below you can see the difference between net contributions and net payments….all adding to the confusion:
As Rod Liddle, then editor of the Radio 4’s Today programme, said: “The whole ethos of the BBC and all the staff was that Eurosceptics were xenophobes.” He recalls one meeting with a senior BBC figure over Eurosceptic complaints of bias. “Rod, the thing you have to understand is these people are mad. They are mad.”
I guess the BBC is still trying to get over that message…criticise the EU and you are either a knave or mad, mad, mad.
her leftist bias means she is ideal for QT, however, in BBC terms “she aint no looker”, or in B-BBC terms ” what an ugly trollop”, means shes best left on the radio. Plus VD on the QT just doesnt sound right
As rapier-sharp intellectuals struggling in a male-dominated world of journalism, Stephanie Flanders and Victoria Derbyshire bow to no man, except when they are taking up Labour MPs on sticky issues.
‘….using statistics provided by BBC bean counters, tax experts in the BBC business unit…’
The alarm signals are already ringing.